You should spend about 20 minutes on this task.

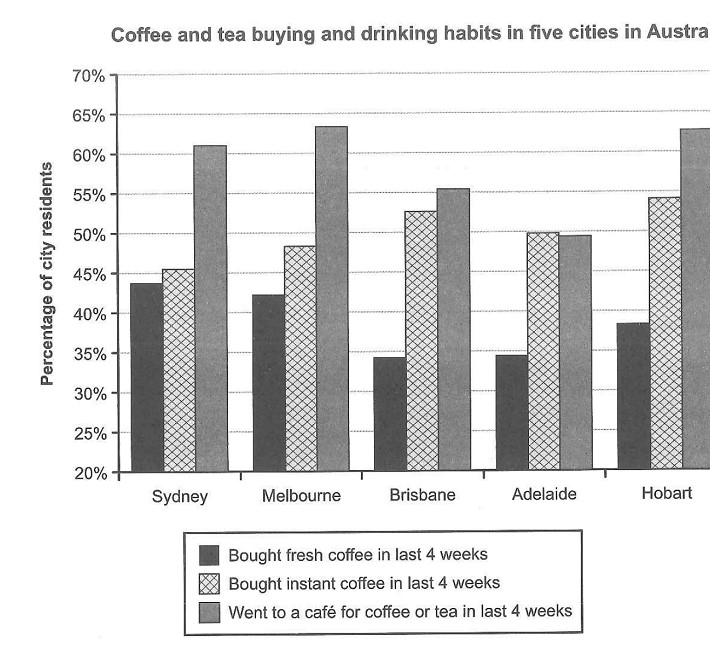
The chart below shows the results of a survey about people's coffee and tea buying and drinking habits in five Australian cities.

Summarize the information by selecting and reporting the main features and make comparisons where relevant.

Write at least 150 words.

The given bar chart illustrates the extent to which people in five Australian cities are accustomed to purchasing and drinking tea and coffee.

Overall, in all cities, except Adelaide, going to a café for coffee or tea was the most preferable choice, followed by buying instant coffee. Concerning going to a café to drink tea or coffee, there was little difference between the shares of people in Melbourne and Hobart, as 64% of the people in the former went to a café, while the share of the latter was slightly lower by a margin of 1 percent. Sydney was the third city with the highest proportion of café goers at a high of just over 60%. The tendency of going to café was lower in both Brisbane and Adelaide at about 55% and 50%, respectively.

Turning to the instant coffee figures, the highest proportion of buyers was from Hobart at just under 54%, followed by Brisbane at about 52%. Also, half of the people in Adelaide bought instant coffee, and in Melbourne and Sydney, the figures were lower at about 48% and 46%, respectively.

The figure for buying fresh coffee was the lowest in all cities, ranging from Sydney's 44% to Adelaide and Brisbane at 34%.

Grade: 7