
You should spend about 20 minutes on this task.
The graph below shows the number of tourists visiting a particular Caribbean island between 2010 and 2017.
Summarize the information by selecting and reporting the main features, and make comparisons where relevant.
Write at least 150 words
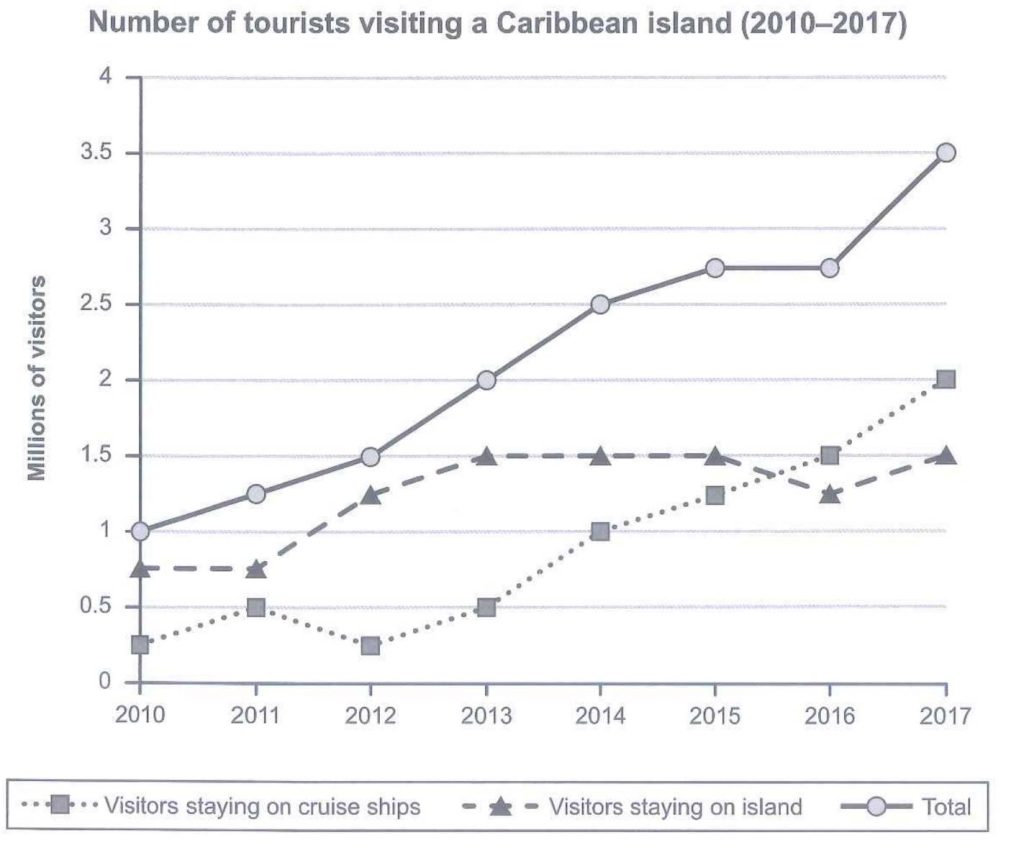
The graph displays the statistics of (the number at tourists visiting a particular carribean island between (the years) 2010 and 2017) in the year 2010, there were a quarter of a million visitors that stayed on cruise ships, while another 750000 visitors were staying on island that totals up to a million of visitors during that year. The following year, which is 2011, half a million visitors stayed on cruise ships for the visitors who were staying on the island, the graph doesn't show and decrease or an increase because the number was the same as the previous year, which is 750000 visitors. Total visitors for that year was I million and a quarter visitors. Moving on, the number of visitors staying on cruise ships decreased to 250000 visitors in the year 2012 while the number of visitors staying on island increased to 1250000 people. This sums up to an amount of 1500000 visitors that year. In the year 2013, 500000 visitors stayed on cruise ships while 1500000 visitors stayed on island that adds up to 2 million visitors that year. During the next year which is 2014, a total at one million visitors stayed on cruise ships while the same number of visitors staying on island remained consistent which is 1500000 people, totalling up to two million and a half visitors that year. For the
year 2015, 1250000 visitors were staying on cruise ships and 1500000 tourists were staying on island, showing no changes from the previous year. The total of tourists in that year increased to 2750000 visitors. The total number of visitors remained the same in the following year which is 2016 where it summed up 1500000 visitors staying on cruise ships and 1250000 visitors staying on island. In the final year. 2017, the number of visitors staying on cruise ships and staying on island increase to three and a half million of visitors. The graph showed an increase of half a million for the number of visitors staying on cruise ships which totals up to two million visitors. As for the number of visitors staying on island, the graph also increased for a quarter million which adds up to a total of 1500000 visitors that year.
Through the years, the number of visitors staying on cruise ships showed an unstable increase and decrease for the first four years, but continued to increase in the next year onwards. As for the number of visitors staying on island, there was no progress of increase or decrease in the first two years which are 2010 and 2011 but the graph rose until it remained constant for three. consecutive years in a row. The number of visitors then slacked off in the year 2016, but managed to increase to the same level as the year before the previous in 2017. All in all, the graph showed an outstanding performance for the total number of visitors throughout 2011 to 2017, where it increased gradually every single year except from 2015 to 2016 where it remained constant.
Grade: 7
This is a full and detailed description of the data contained in the graph, supplemented by a comparison of the variations in the numbers for the two types of visitors (staying on cruise ships or staying on the island). There is a clear overview at the end of the description. Organisation is fairly clear and progresses logically across the time period, although it could be improved by subdividing the rather long second paragraph. The range of vocabulary is wide enough to show some variety of expression [adds up to | totals up to] and some use of collocation [three … years in a row]. There is a high level of accuracy in grammatical control, in both simple and complex structures, but there is an omission of a full stop between the first and second sentences and no capital letter to indicate the beginning of the new sentence.