
You should spend about 20 minutes on this task.
The table below shows the projected costings over the next five years in American dollars for three environmental projects for sustainable forestry. The pie chart shows the expected expenditure breakdown allocation for the first year as the projects are set up.
Summarize the information by selecting and reporting the main features, and make comparisons where relevant.
Write at least 150 words.
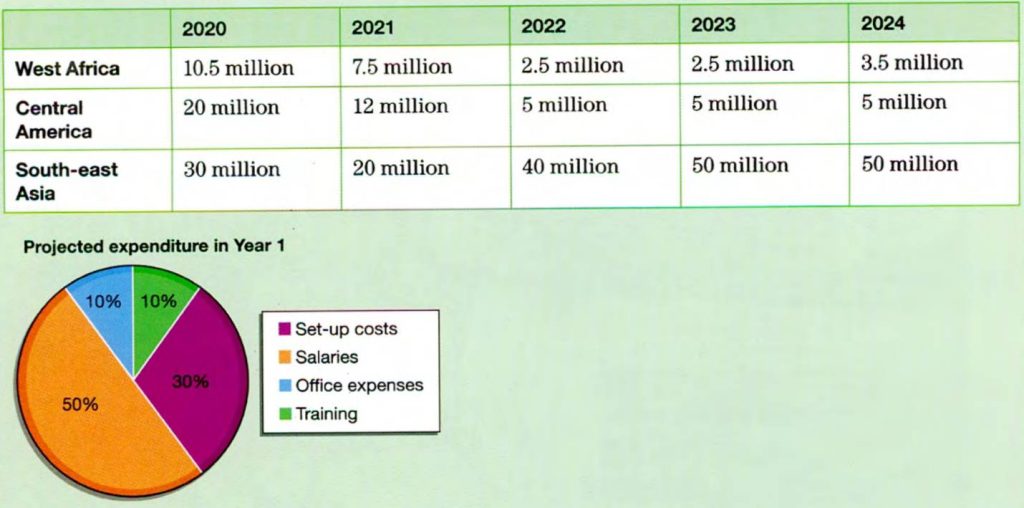
The table shows the estimated costs of environmental projects in three different areas. The pie chart gives a breakdown of the costs in the first year.
In 2020, the projected cost for the West African project is 10.5 million dollars. It is forecast that this figure will fall to just 2.5 million in 2022 and 2023, but it is expected it will rise to 3.5 million in 2024. The Central American project is predicted to cost 20 million in the first year but by 2022 annual expenditure will have fallen to 5 million. It will then remain unchanged. However, in South-east Asia the projected cost for 2020 is 30 million and expenditure will reach 50 million in 2023 and 2024.
According to the pie chart, 60 percent of the budget for year one will be spent on salaries and 30 percent on set-up costs. Training and office expenses will each make up 10 percent of the total. It is clear that by far the greatest amount of money will be spent on the South-east Asian project and, unlike the other two, annual costs will rise. (189 words)
Grade: 8~9
Paragraph one paraphrases the rubric. Paragraph two gives details about all the projects and gives an overview by pointing out the differences between the third project and the previous two. Paragraph three gives details about the pie chart.