You should spend about 20 minutes on this task.

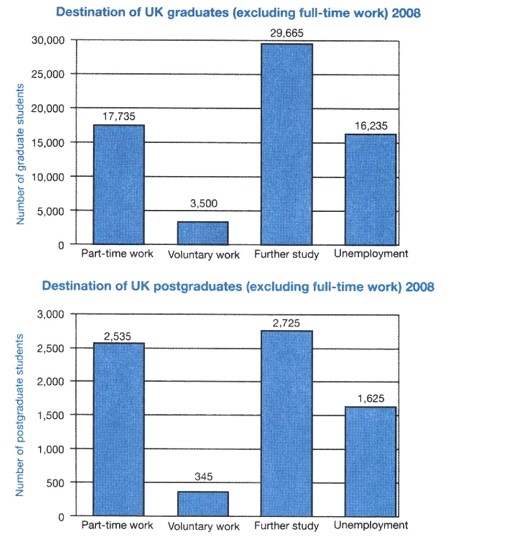
The charts below show what UK graduate and postgraduate students who did not go into full-time work did after leaving college in 2008.

Summarize the information by selecting and reporting the main features and make comparisons where relevant.

Write at least 150 words.

The bar charts illustrate what the graduates and postgraduates in Britain did after finishing college in 2008. Those who opted for full-time work were not included in the survey.

Overall, further study was reported to be the most popular option among both graduates and postgraduates, followed by part-time work. Also, others were either left unemployed or, to a fewer extent, chose voluntary work.

Concerning the British graduates in 2008, as many as about 30000 students sought higher education. Part-time work was the second most popular option with nearly 18000 alumni finding a part-time job. A massive 16235 students were unable to find a job and the figure for voluntary work stood last, being chosen by merely 3500.

The trend for the postgraduate was similar to that of graduates. There was little difference between the shares of further study and part-time work, as the former accounted for a high of 2725 students, whereas the latter consisted of 2535. Like the figures for the graduates, unemployment and voluntary work made up the lowest numbers (1625 and 345, respectively).

Grade: 7.5