
You should spend about 20 minutes on this task.
The bar chart shows the percentage of people in the United Kingdom per age group without any qualifications.
Summarize the information by selecting and reporting the main features and make comparisons where relevant.
Write at least 150 words.
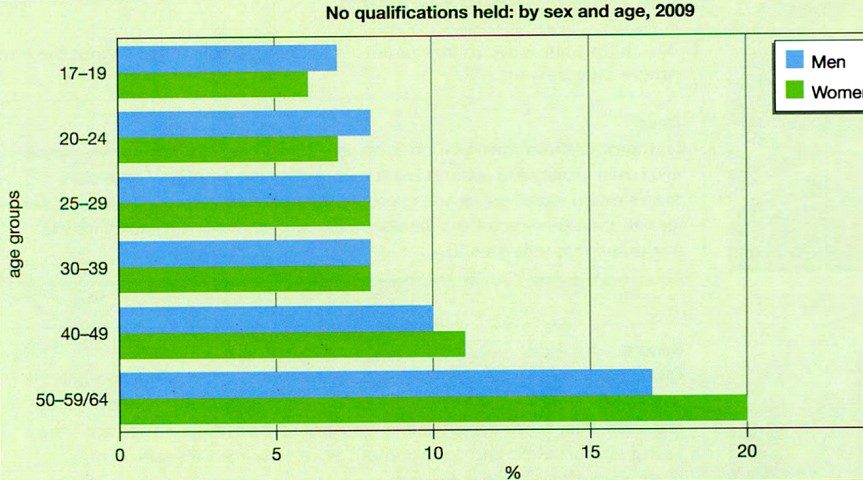
The chart provides information about the proportions of males and females in the UK by age group in 2009 who did not have any qualifications.
Among those aged 17-19 and 20-24, more males than females lacked qualifications, approximately 7% and 6%, and 8% and 7% respectively. As regards the 25-29 age group, there is no difference in the proportions of men and women without qualifications at around 8% for both sexes with the same pattern being seen for the 30-39 age group. By contrast, among those aged 40-49, the lack of qualifications was greater among women compared to men (1296 as opposed to 1096), while more women in the oldest age group (about 20%) did not have any qualifications compared to around 1796 for men.
Generally speaking, it is clear that there is a greater proportion of men compared to women without qualifications in the youngest age groups whereas the reverse is true for the oldest age groups. (159 words)
Grade: 8~9
This is a good model answer. The introduction is a paraphrase of the rubric and there is a clear overview at the end of the answer. The answer is divided into paragraphs. All the data is compared and there is a range of vocabulary and grammatical structures, including complex sentences.